


Ece Irmak Alpsoy - 1
The line graph below shows changes in the amount and type of fast food consumed by Australian teenagers from 1975 to 2000.
Summarize the information by selecting and reporting the main features and make comparisons where relevant.
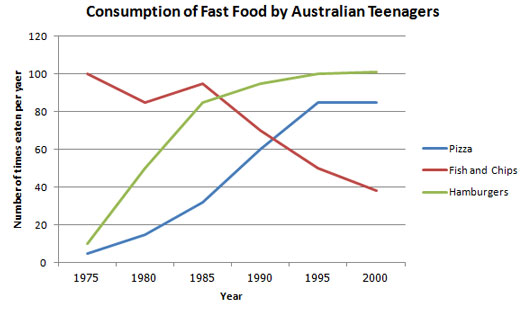
The line graph illustrates Australian teenagers' fast food preferences and consumptions in the number of times per year from 1975 to 2000. From an overall perspective, it is seen that pizza and hamburgers consumption increased among Australian teenagers. However, fish and chips consumption decreased in 25 years.
It can be clearly seen that hamburgers was loved by Australian teenagers more than other two fast food kinds. In 1975, hamburgers consumption was under 20 times eaten per year, but it rose sharply until 1985, and after this year, the rise in the consumption of hamburgers continued steadily but slowly and reached its peak point with 100 times eaten per year. Similarly, pizza was not popular with Australian teenagers in the beginnig at the period, but it began to climb slightly from 1975 until 1995. In this year, its consumption level did not change until 2000. It was the second most preferred type of fast food by teenagers in the end of the given time.
In contrast, fish and chips consumption fell down sharply from 1975 to 1980, approximately 80 times per year. After 1980, it went up abruptly to almost 100 times per year until 1985. Nevertheless, a declining trend in the consumption of this fast food type started from 1985 to 2000, and its eaten number reached less than 40 times per year in the end of the given period.
Comments
Post a Comment