Muna Abdullahi - 1
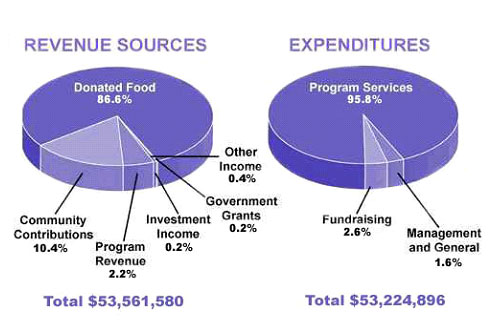
The pie chart shows the amount of money that a children's charity located in the USA spent and received in one year, 2016.
Summarize the information by selecting and reporting the main features and make comparisons where relevant.
Revenue Sources and Expenditures of a USA Charity in one year, 2016.

The pie chart above illustrates the quantity of money a children's charity situated in the United States obtained and utilized in the year 2016. The total amount gained and used was fairly equal portions; however, the majority of income was 'donated food', whereas program service accounted for the majority of consumption.
To begin with, the bulk amount of contribution came from donated food with just over fourth-fifth percentage while community contributions part was the second income source with around one in ten ratio. In addittion, program revenue section supplied a small amount with just under 2.2 percent. Government grants, investment income and other income sources provided nearly similar amounts with less than one percent.
On the other hand, according to the second pie chart, most of the expenditures was spent by program services with around 96 percentage of all the budget. Additionally, the sum that was used in fundraising was a small amount with about 2.6 %. Furthermore, the least proportion of consumption was utilized in Management and General portion with 1.6%.


Comments
Post a Comment