


Furkan Odabaş - 5
The line graph below shows changes in the amount and type of fast food consumed by Australian teenagers from 1975 to 2000.
Summarize the information by selecting and reporting the main features and make comparisons where relevant.
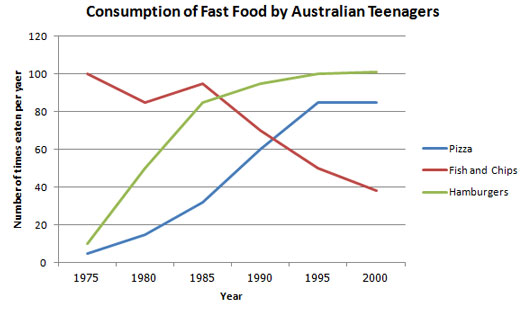
In the line graph, the numbers of consumption of different fast foods which were prefered by Australian teenagers between the years 1975 and 2000 are shown. Overall, it is seen that while the numbers of eaten hamburgers and pizza showed a sharp increase, that of fish and chips dropped dramatically.
To begin with, in 1975, it can be seen that fish and chips was the most prefered fast food with 100 times eaten per year which is nearly 10 times more than consumed hamburgers and pizza. However, it performed a rapid decrease in nearly whole the 25-year period expect a gradual rise from 1980 to 1985. Conosequently, the consumption amount of fish and chips fell over during this period to finish approximately at 40.
In significant contrast to this, pizza consumption was the least at the begginning of time period. It showed a constant rise from 1975 to 1995 and it overran the number of fish and chips in 1990. After 1995, it remained stable until the end of period. The consumption of hamburgers followed a similar path with that of pizza. The sharpest rise was seen in hamburgers as a result of the steep rise from 1975 to 1985. After that increase, it continued to a slowing increase to 2000 and it finished the period with 100 times eaten per a day which is the number that fish and chips began.
Comments
Post a Comment