Furkan Odabaş - 4
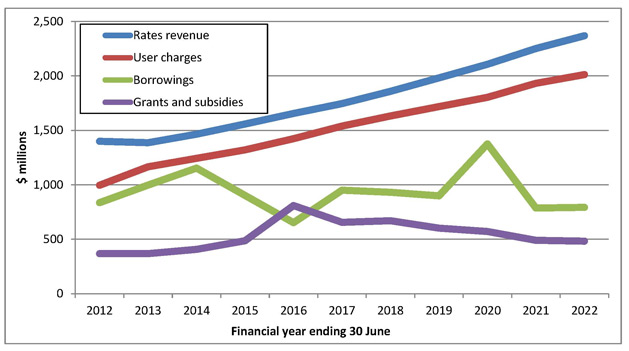
The line graph shows the past and projected finances for a local authority in New Zealand.
Summarize the information by selecting and reporting the main features and make comparisons where relevant.

The line graph demonstartes the financial situation of a local authority for a timeframe from 2012 to 2022. Overall, it can be clearly seen that rates revenue and user charges are predicted to rise grdaually while the borrowings, grants and subsidies are predicted to secure their beginning positions.
First of all, rates revenue and user charges will show a similar manner and rise gradually but constantly. In addition, the rates revenue will end up in 2022 with a higher number than the user charges number with over 2,250 million US dollars, just as it is the case for their position in 2012.
On the other hand, borrowings will stay at their first number by following a fluctuated trail. Although it rose sharply from 2012 to 2014, it started a dramatic decrease in 2014 and it is predicted to continue falling until 2016. Following this, it is predicted to show a steep rise from 2016 to 2017 and stay stable until 2019. Nextly, it will increase quickly and peak in 2020 with a number slightly over 1,250 million US dollars. After this peak, it will fall rapidly until 2021 and it is predicted to secure its level until the end of timelapse. Lastly, grants and subsides will end the period slightly over their beginnng number which was the least of four criteria. They started to grow in this year and it is predicted to peak in the next year with a number significantly over 500 million US dollars.


Comments
Post a Comment