


Furkan Odabaş - 2
The bar chart shows the number of times per week (in 1000s), over five weeks, that three computer packages were downloaded from the internet.
Summarize the information by selecting and reporting the main features and make comparisons where relevant.
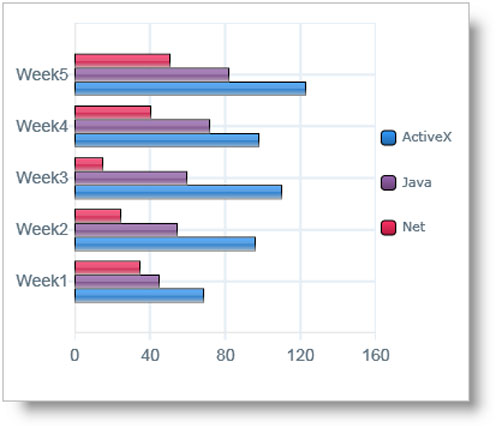
The bar chart demonstrates three different computer packages and changes in their download numbers for a five-week timeframe. Overall, it can be clearly seen that all three programs experienced increase in the end of the given timeframe.
To begin with, ActiveX was the most popular package in the beginning with just over 60 download, which is nearly two times more than Net downloads, and it secured its place with slightly over 120 by depicting an almost constant rise expect a drop from Week 3 to Week 4. Java was the second most preferred computer package, which rose gradually and constantly; consequently, it got its place in the ranking over 5 weeks timelapse with nearly 80 times per week.
Secondly, Net also increased from Week 1 to Week 5 just like the others but its manner was different at some points. It fell rapidly from Week 1 to Week 3 while other two packs kept rising. It was at just under 20 in Week 3 and it showed a sharp increase from that point until the end of the period. Despite this rise, it finished the timescale in third place which was its position in the beginnig of the period.
Comments
Post a Comment