Elife Avan - 1
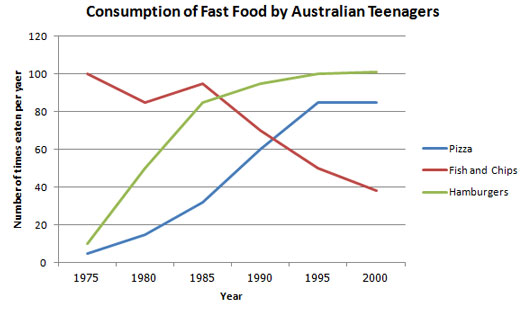
The line graph below shows changes in the amount and type of fast food consumed by Australian teenagers from 1975 to 2000.
Summarize the information by selecting and reporting the main features and make comparisons where relevant.

The line graph illustrates the fast food consumption habits of Australian teenagers between the years 1975 and 2000. Overall, it is clear that in the given period, while there was a dramatic decline in the consumption of fish and chips, the consumption of pizzas and hamburgers rose steeply.
Hamburger and pizza consumption was less than 10 per year before 1980s. Both of them went up in a short time, almost in five years. Although their consumptions appear to be at a similar level at first, the number of eaten hamburgers rose from around 40 times in early 1980s to 80 times in 1985. In 1995, hamburger's consumption levelled off at a hundred times per year whilst the number of consumed pizza became stable over 80 times per year. Thus, they arrived at the rate of consumed fish and chips that was 100 times per year in 1975.
Fish and chips which was eaten a hundred times per year in the begining of the period dropped sharply in 1980. Its consumption started rising again until 1985 for a while and arrived the level of almost 90 times per year. However, it followed a gradual decreasing trend until the year 2000 and reached its lowest rate with 25 times per year.


Comments
Post a Comment