Seçil Güneş - 4
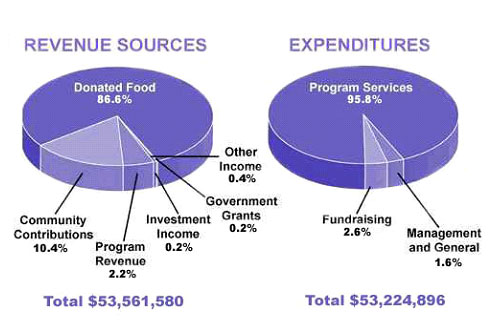
The pie chart shows the amount of money that a children's charity located in the USA spent and received in one year, 2016.
Summarize the information by selecting and reporting the main features and make comparisons where relevant.
Revenue Sources and Expenditures of a USA Charity in one year, 2016.

The two pie charts indicate the amount of revenue sources and expenditures of a children's charity based in the USA in the year 2016. Overall, according to these two charts, it can be fairly seen that the most significant source of revenue was donated food, and on the other hand, the largest proportion of expenditures was program services. The total donation sources just passed over outgoings.
When we take a close look at revenue source chart, we notice that donated food represented a very large majority with 86.6% of all incomes. The second largest revenue source was community contributions with approximately one in ten. The total proportion of the program revenue, investment income, government income, and other income was a very small number around at 3%. Furthermore, the percentage of program revenue covered 2.2% of this proportion.
As for the expenditure chart, it is observed that program services had almost the all amount of money for the children's charity with 95.8%. Fundraising and management and general spending accounted for 2.6% and 1.6%, respectively. The total expenditures of these two sorts elucidated a small portion.
In conclusion, when we look at the balance between the total income and outcome, we can clearly notice that a charity profit for the total income was just under 350.000 dollars in the year 2016.


Comments
Post a Comment