Melike Coşar - 1
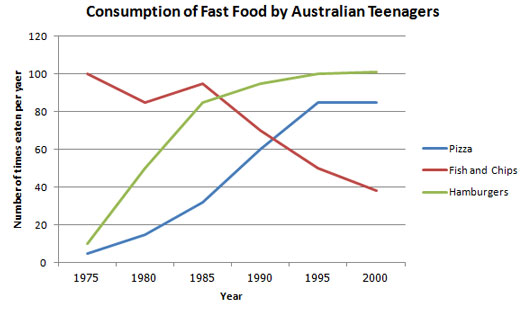
The line graph below shows changes in the amount and type of fast food consumed by Australian teenagers from 1975 to 2000.
Summarize the information by selecting and reporting the main features and make comparisons where relevant.

The line graph illustrates some information about the number of times of consumption of three types of fast food, pizza, hamburgers and fish and chips by Australian adolescents in the years from 1975 to 2000. Overall, it is clearly seen that during the period of 25 years, the consumption of pizza and hamburgers increased while the consumption figure for fish and chips presented a decreasing trend.
In the beginning, it is quite obvious that which was eaten 100 times in 1975 was the most popular fast food with the Australian teenagers. However, there was a fluctuation between the years 1975 and 1985. Its trend of popularity dipped from 1975 to 1980, but after this year it had a recovering inclination until 1985. Yet, after this year, it kept a falling direction and went down to its lowest level, a little under 40 times, at the end of the period.
In sharp contrast to fish and chips figure, there was an appreciable growth in preference of hamburgers and pizza by Australian juveniles in the same year. These two fast food types began from their lowest level by being consumed approximately 10 times in a year. The consumption of Hamburgers increased rapidly from 1975 to 1985 ,then it rose steadily and reached its peak point in 1995 and remained stable until the end of the period. As for pizza, it is observed that, similarly, the number of pizza eaten by Australian teenagers experienced an increasing trend from 1975 to 1995, and after this year, it levelled off towards the end of the given period of time.


Comments
Post a Comment