


İrem Kılıç - 8
The chart shows components of GDP in the UK from 1992 to 2000.
Summarize the information by selecting and reporting the main features and make comparisons where relevant.
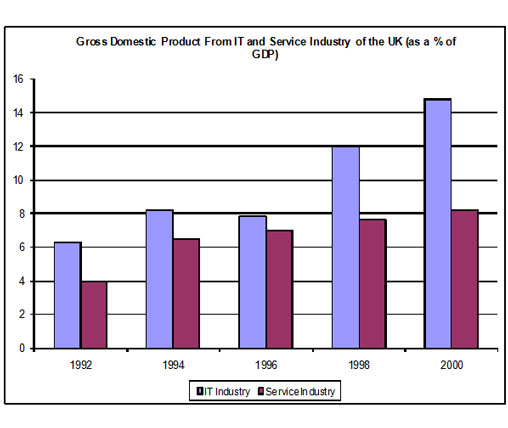
The chart demonstrates the ingredients of GPD from IT and Service Industry in the UK in the years between 1992 and 2000. It was measured in percentages. Overall, it is seen that gross domestic products which were produced from IT Industry gradually increased its numbers, except for a slight fall in 1996. Similarly, Service Industry rose its production of GPD throughout the period.
In 1992, gross domestic product from IT Industry started at just over 6%, while Service Industry manufacturer of GPD began at only 4 percent. In later years, IT Industry increased its GPD production by almost threefold, and finished at over 14%, although it fell slightly from 1994 to 1996.
When it comes to Service Industry, it is observed that its manufacturing of GPD was lower than IT during the eight years period. It began with 4 percent, and increased at just over 6% in 1994. Over the next six years, it showed a slow rise in production with only 2 percent totally, and finished at 8 percent in 2000. However, the supremacy of IT countinued, and at the end of the period, the percentage of GPD from IT Industry reached almost twice that of Service Industry.
Comments
Post a Comment