İrem Kılıç - 10
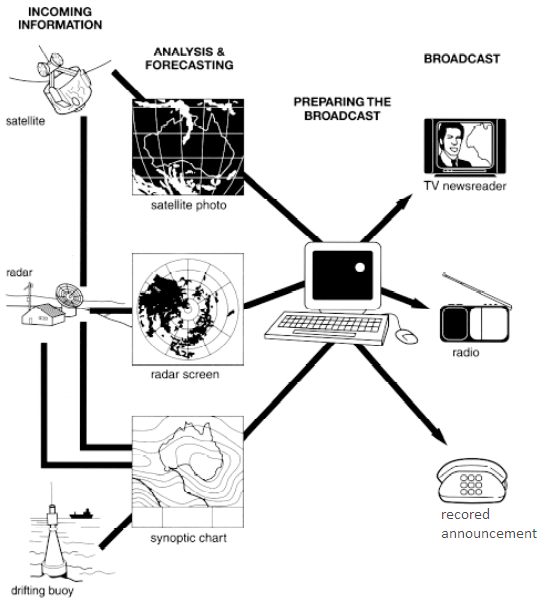
The diagram below shows how the Australian Bureau of Meteorology collects up-to-the-minute information on the weather in order to produce reliable forecasts.
Write a report for a university lecturer describing the information shown below.

The given diagram gives information about how the climate information is gathered by Australian Bureau of Meteorology to provide accurate and updated weather forecasting. Overall, it can be seen that there are four stages in the process beginning with the collecting information about the atmospheric conditions. This data then are analyzed and forecasted, prepared for electronic media sources, and finally are broadcasted to the public.
First of all, it is obvious that the climate information is accumulated by three different types of sources, which are satellite, radar and drifting buoy. After receiving data about weather, satellite can perform in two ways, showing the information for analysis and forecasting on a satellite photo or sending them to the radar. Following this, the weather conditions are evaluated and anticipated via radar presented on a radar screen or synoptic chart. Likewise, drifting bouy shows the atmospheric information that it took on a synoptic chart.
To conclude, as it is presented in the diagram, all the data coming from satellite photo, radar screen or synoptic chart is brought together on the computer to make them ready for broadcasting. When the climate information is ready to be published, it is distributed radio, to television and recored announcements tools to inform people about the weather predictions.


Comments
Post a Comment