Özge Top - 12
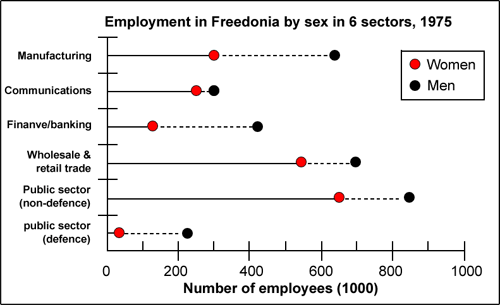
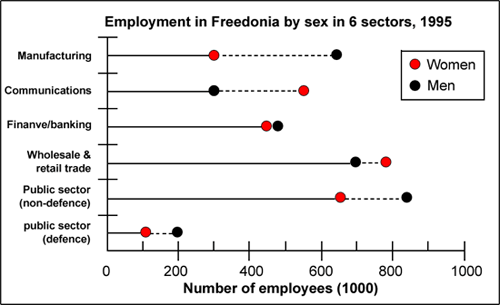
The graphs below show the numbers of male and female workers in 1975 and 1995 in several employment sectors of the republic of Freedonia.
Write a report for a university teacher describing the information shown.


The two charts illustrate how the count of female and male empleyees changed in The Republic of Freedoina from 1975 to 1995. Overall, we can clearly see that while the number of men empleyees were higher than the figures of female employees in 1975, the figures of female employees exceeded the number of males in different two work areas in 1995.
In details, the number of employees remained stable in manufacturing and public sector (non-defence) fields between 1975 and 1995. Despite increasing the number of women, the count of men slightly slumped in public sector (defence) area in 1995. However, whereas the counts of female and male were nearly the same in 1975, the number of female nearly doubled the that of male on communications field in 1995. Nevertheless, it can be seen that the number of women exceeded that of men in wholesale & retail trade field in 1995. On the other hand, the count of females sharply climbed and passed the figure of male in finance/banking area in the given time frame.
As a
consequence, according to given the charts, while the figure of women
was noticeably lower than that of men in 1975, the number of female
surpassed to that of male in the given period. As a result of this,
thee total number of female employees substantially went up in the
given time. At the end of the period it is noticed that the number of
men employees was approximately the same as their number in the
begining of the period.


Comments
Post a Comment