Candan Şeviktürk - 6
The chart and table below give information about population figures in Japan.
Summarise the information by selecting and reporting the main features and make comparisons where relevant.
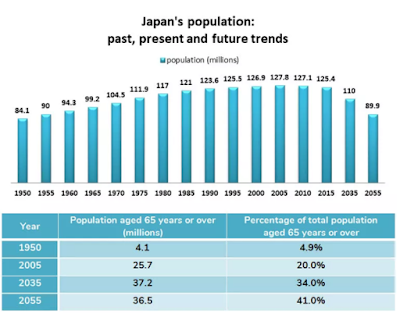
The bar chart represents Japan's population from 1950 to 2055, a 105 years period. The table shows 65 years old or over population in millions and the percentages of the total population of this age group. Overall, it is seen that the number of population in millions follows an increasing trend from 1950 to 2005.
According to the given data in the bar chart, while the population was 84.1 million in the begining of the period, it touched its peak point after 55 years in 2005. Yet, after a decreasing inclination from this year, it is clear that it will end the duration with 89.9 million in the year 2055.
The table demostrates that both the population and the percentage of the elderly generation experienced an augementaion in the given time period. It is seen that after 105 years the population of Japan will reach to the point of approximately 9 fold of its value in 1950. As for the percentage of the elderly people, a sharp hike of almost 10 times is obviously noticed during this period.


Comments
Post a Comment