


Candan Şeviktürk - 3
The chart below shows the amount of leisure time enjoyed by men and women of different employment status.
Write a report for a university lecturer describing the information shown below.
Leisure time in a typical week in hour- by sex and employment status, 1998-99.
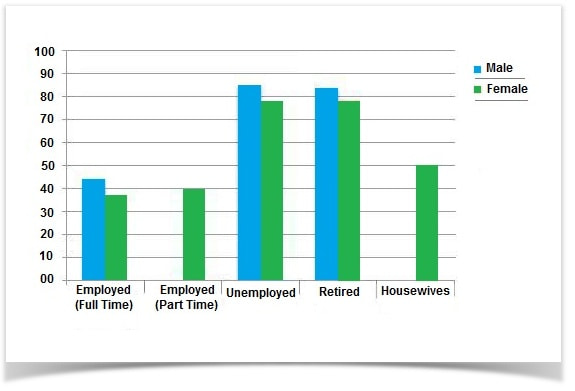
This bar chart represents leisure time in a typical week by women and men of different employment in five categories from 1998 to 1999. Overall, unemployed and retired male and females spend the highist amount of time on leasure activites .
The bar chart shows that full time employed males spend a little bit more time than full time employed woman. It is clearly seen that part time employed females spend time a little more than full time employed females do. However, there is no data about part time employed males.
As for unemployed and retired people, it is obviously noticed that males and females experienced simillar situations which are over 80 hours per week for males and slightly less than this number for females. It is not suprising to see that housewives with 50 hours per week spend more time on leisure activities than employed part time people and even part time employed woman do.
Comments
Post a Comment