Arzu Kırıcı - 2
The
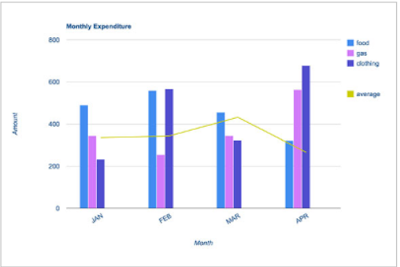
bar chart shows the monthly spending in dollars of a family in the
USA on three items in 2010.
Summarize the information by selecting
and reporting the main features and make comparisons where relevant.
The bar chart compares the monthly expenditure on food, gas and clothing of a family living in the USA in 2010. Overall, it is quite noticeable from the given chart that the levels of expenditure fluctuated over the period. The expenditure was in dollars and legends depict the different items.
To begin, in January, most of
the family's income was spent on food, at approximately $500 per
month, whilst the least money was spent on gas and clothing, on
average $300 and $230, respectively. In February, the amount of money
spent on food and clothing increased slightly compared to that in
January. Because of the cold weather in February, the amount of
spending on gas decreased as the use of vehicle reduced due to
weather conditions. In March, the expenditure on food and clothing
dropped, while the spent money on gas showed a slight rise. Owing to
the approaching summer, the expenses on clothing and gas hiked
sharply and hit their highest points in April, at about $700 and
$570, sequentially.
Based on the bar chart, the average
consumption was related to people's needs and the weather conditions
were the biggest reason to influence the demand. With the exception
of an escalations in March, the average spending decreased slightly
over the four months period.


Comments
Post a Comment