


Özge TOP - 2
The chart below gives information about the number of social networking sites people used in Canada in 2014 and 2015.
Summarise the information by selecting and reporting the main features, and make comparisons where relevant.
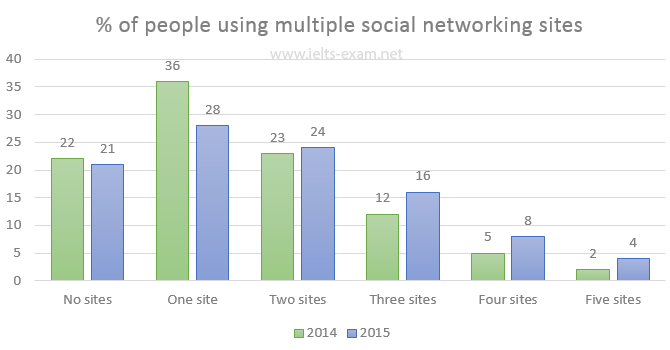
The bar chart illustrates the percentage of multiple social networking sites used between the years 2014 and 2015 in Canada. Overall, it can be seen that the highest rate in these two years belongs to one site. Beside, it is observed that five sites usage has the lowest rate between six other variables.
In details, even if the rate of one site had the highest percentage among other rates in 2014, this rate came down by eight point in 2015. Moreover, the 'no sites' category and 'two sites' category had highly close ratios in both years with 22-21 and 23-24 percentages, respectively. The rate of other 'three sites', 'four sites' and 'five sites' categories increased sharply throughout these two years. The 'three sites' experienced the highest rising point compared with the other types.
To sum up, multiple site utilization remarkably supplemented in 2015. No sites usage slumped by one point even so it had a considerable proportion. On the other hand, one social networking site category went down substantially by eight percent. In these two years, the preference of people did not change dramatically.
Comments
Post a Comment