


Berfin Bozdemir - 6
The graph below shows the number of university graduates in Canada from 1992 to 2007.
Summarise the information by selecting and reporting the main features and make comparisons where relevant.
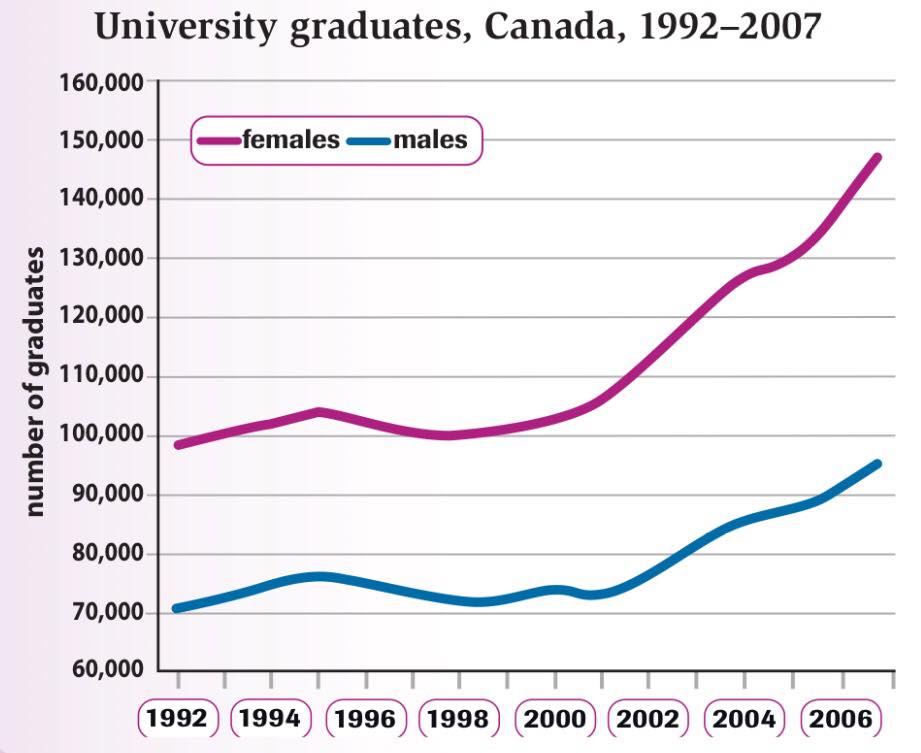
The line graph illustrates the number of females and males who graduated from university in Canada over the years 1992 and 2007. Overall, it can be clearly seen that graduated women outnumber graduated men in the whole time period.
To begin, the number of women who graduated started the period from just under 100,000 in 1992. After a gradual increase, it followed a slightly decreasing trend until the year 1999. After almost the second half of the period which is after the year 2000, it experienced a significant rise and culminated at its peak point with approximately 148,000 number of graduates. Moving to men, we notice that the rates in this category were by far less than those in the women category. The number of bachelors in terms of men started from 70,000 and followed a highly similar pattern with the line graph behaviour of graduated women until the year 2000. After this year, it had a rising inclination until the end of period and finished the duration at around 95,000 in 2007.
It is immediately apparent that the number of collegians was mostly generated by women whose number considerably outweighed that of men during the whole time period. While the total increase in the number of graduate women was nearly 45.000, the hike in the number of men was much lower with nearly 25.000, from the beginning to the end of the given time, which reflects the fact that women were far more successful than men in graduating from university.
Comments
Post a Comment