Özge Top - 1
The pie charts below show electricity generation by source in New Zealand and Germany in 1980 and 2010. Summarise the information by selecting and reporting the main features, and make comparisons where relevant.
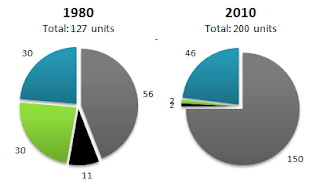
The given pie charts present the condition of electricity generation by source in New Zealand and Germany in the years 1980 and 2010. Overall, it can be clearly seen that the total used units increased and both countries prefered to use only one source of energy after 30 years.
To begin, it is noticable that the coal consumption needed for New Zealand’s electricity production dramatically rised by 94 units. Also, the hydro consumption increased by 16 units which made it the second most used resource in New Zealand. However, the units of natural gas and petroleum exceeded in this country over the 30 years. Over the same period, the use of Nuclear ascended quite considerably. With this increase, it became the most used resource in Germany. Natural gas resource, which was used 28 units in 1980, fell to 2 units in 2010. Moreover, the need for coal was still the same for 30 years.
Finally, the pie charts reveal the fact that water energy usage increased in Germany but fell in New Zealand in the given period of time. There was a significant increase in the use of certain resources in both countries. Moreover, it can be observed that the main energy source was nuclear in Germany while it was coal in New Zealand.


Comments
Post a Comment