


İlkan Serbes - 1
The charts below give information about teachers’ views of managing student use of smart phones in the classroom, and secondly, how students use smart phones in the class.
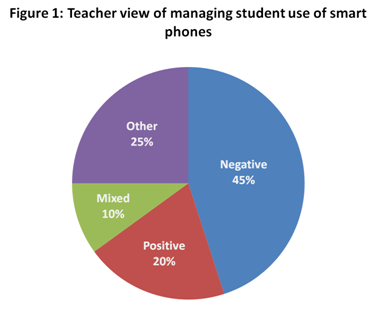
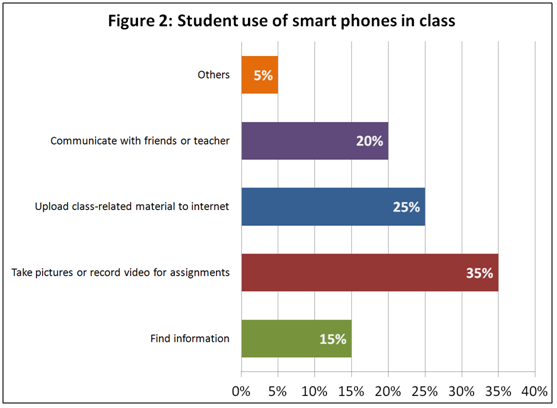
The bar chart shows how students use their mobile phones in the class and the pie chart presents how the teachers react to this issue. Overall, it can be clearly seen that teachers do not have a consensus on this topic.
Firstly, it is obvious from the pie chart that almost half of the teachers do not support students' using of smart phones in the class. Yet, 20 percent of the teachers have positive aspects towards this issue. Also, 10 percent of the teachers do not hold any clear views to this subject at school. A good percentage of the teachers; namely, % 25, presented 'other' points of views to this matter.
On the other hand, the bar chart reveals the fact that students use their smart phones for a variety of reasons in the class. While a majority of the students (%30) use their phones to authenticate their assigments, a quarter of them use them as an uploading tool, and less than this percentage of the students get help from their phones to communicate with others. The reason for using the device for the purpose of getting information and 'other ' reason constitute only a small portion of the reasons.
Comments
Post a Comment