Posts

Showing posts from April, 2021

İlkan Serbes - 7

As people live longer and longer, the idea of cloning human beings in order to provide spare parts is becoming a reality. The idea horrifies most people, yet it is no longer mere science fiction. To what extent do you agree with such a procedure? Have you any reservations? Humans have already found the cloning technology which was initially tried on the animals. The next step is to apply this technology on human body. This application may seem beneficial in many aspects, but a great number of people have concerns about how ethical this procedure can be. Firstly, it is a fact that humans are programmed to die. When we get older, our vital body parts become inefficient day by day and eventually, our biological system collapses. The cloning technology is the key solution for this aging problem. By using cloning technology, the old and dying organs can be reproduced with the help of patient’s genes. As a result, the problem of compatibilization of patient body will be overcome t

İlkan Serbes - 6

Image
The diagram shows how tea leaves are processed into five tea types. Summarize the information by selecting and reporting the main features and make comparisons where relevant. The diagram shows the manufacture of five different types of tea. Overall, although they are made from the same leaf, different processes such as, fermentation, steaming and crushing make them different To produce all types of tea, firstly tea plants are grown. After this stage, they are plucked and wilted. After these processes, different steps are followed for each type of product. The last common step for all types is oven drying. Firstly, it is seen in the diagram that white tea does not need any kind of process. After the oven drying, it is ready to be consumed. The green tea is steamed and rolled after the wilting phase before entering the oven drying process. Oolong tea is also rolled and slightly fermented after wilting tier. Large and small black tea types have

Merve Cura - 8

Image
The graph below shows the proportion of the population aged 65 and over between 1940 and 2040 in three different countries. Summarise the information by selecting and reporting the main features, and make comparisons where relevant. The line graph illustrates the number of people who are 65-year-old and over, from the year 1940 to 2040 in the USA, Sweden, and Japan. Overall, none of the given countries' elder population was higher than 10% in 1940. During the given time period these three countries' numbers of people aged 65 and over showed different trends. It is predicted that the proportion of the people this age group will increase significantly in the next two decades. It can clearly be seen that the elder populations in the USA and Sweden demonstrated similar trends from 1940 to the end of the 1990s. From 1990 onwards, given population in Sweden showed a fluctuating upward trend, while the rate in the USA remained same, until the beginning of 2020s. It is anticipat

Merve Cura - 7

Universities should accept equal numbers of male and female students in every subject. To what extent do you agree or disagree? An argument which is commonly put forward about gender equality is that in higher education, the same number of men and women students should be accepted for each department. Although this opinion can be useful in numerous ways, I do not agree with it. Promise to provide equity in numbers can encourage young people to choose a major that they did not consider before because of the major's label. For example, a young woman can enroll in an engineering program, which is labeled as man's area, while a young man can decide to study child development which has a "girly" stigma. In addition, this kind of settlement can contribute diversity to courses. For instance, because society has different child-raising attitudes for different genders, during group study men or women students can bring fresh aspects to the subject. On the other hand,

İlkan Serbes - 5

Image
The bar chart shows the scores of teams A, B and C over four different seasons. Summarize the information by selecting and reporting the main features and make comparisons where relevant. The bar chart shows the scores of three different teams which are A, B and C from the year 2002 to the year 2005. Overall, despite the changing of the data, it is crystal clear that team B was far more successful than the other teams in every season. Firstly, for team A, it is seen that the scores of this team followed a sharp increasing trend until the year 2004 when it could almost catch up with team B. Yet, the score of this team dramatically dropped to the score a little bit more than its score in the beginning of the period, 2002. The graph presents the score of team B as the best score in the year 2002. The scores of other teams are considerably dominated by the score of this team. The graph order did not change until 2004 when the score of team B experienced a dramatic decrease, but it

Emine Şeyda Satılmış - 4

Image
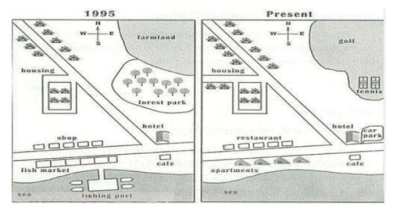
The map below shows the development of the village of Ryemouth between 1995 and present. Summarize the information by selecting and reporting the main features and make comparisons where relevant. The plan illustrates how the seaside village of Ryemouth has changed in the last twenty-six years. Overall, it is seen that from 1995 to the present, the fishing industry and the cultivated area have been removed while settlement area has improved and some sports facilities have been established. In 1995, it can be seen that the fishing industry was highly active in the village because there were a fishing market and a fishing port. Also, a small cafe can be noticed next to the fish market. Five shops and a hotel were built on the east-west direction road. In the north-east part of the village, a forest park and an agricultural area was located and a constructed house zone lay along the coastal road. At that time, there were twelve houses four of which encircled by a smaller side-street.

Emine Şeyda Satılmış - 3

Image
The pie charts show the main reasons for migration to and from the UK in 2007. Summarize the information by selecting and reporting the main features and make comparisons where relevant. The pie charts point out immigration and emigration data in The United Kingdom in the year 2007. Overall, migration statistics shows that the major reason in the both types of migration is the ‘Definite job’ cause. When the two pie charts are compared, it is noticed that the rate of reason for finding a job was almost equal for both immigration and emigration. While this rate was less than a third for immigration, that for emigration was 29 percent. Apart from finding a job, the official study was a significant factor for immigration and while its rate for immigration was over a quarter, the rate of emigration for this reason was a very small number. Another main factor was seeking for employment. The value was dominantly %22 for emigration whereas the grade for immigration was perceptibly

İlkan Serbes - 4

Image
  There are a lot of technological developments which change our living environment. Yet, without any doubt, none of them is as beneficial as the information technologies. Despite this fact, some people are pessimistic about the bad effects of these technologies which maily are related to antisocial behaviour of the users and information corruption. In spite of these harmful impacts which are partly correct, I do not agree with that statement. In my opinion, information technology (IT) is more beneficial than its hazards and this is not a contemporary situation. Firstly, because of the information technology, we can access the information easily and cheaply. This condition affects our education system. This is so beneficial for the education system because thanks to the IT each person’s educating cost can considerably decrease. Furthermore, people who wish to get education on a specific topic can get the chance to have a lot of options for individual learning method such as online

Candan Şeviktürk - 9

Image
The graph below shows the proportion of the population aged 65 and over between 1940 and 2040 in three different countries. Summarize the information by selecting and reporting the main features and make comparisons where relevant. This graph represents the percetagees of the population aged 65 and over from 1940 to 2040 in three different countries. Overall, it is clearly seen that the proportion of the elderly population increased in the past and it will sharply continue its trend until the year 2040. In the beginning of the period; namely the year 1940, the highest rate of this age group belonged to the USA with nearly 10 percent. From 1940 to 1980, the USA's records increased. After this upward trend, it turned to a decreasing inclination until the year  2020. However, the final data in 2040 shows that this country will have the lowest number of old people among the other countries. Sweden illustrates similar pattern. From 1940 to 1980, the rate of this group in Sweden ro

Berfin Bozdemir - 12

Some museums and art galleries charge admission fees, while others have free entry. Do you think the advantages of charging for admission outweigh the disadvantages? Give reasons for your answer and include any relevant examples from your own knowledge or experience. Museums and art galleries reflect and protect our heritage both nationally and  internationally . It has always been a controversial fact that some museums require admission fees while some of them have free entry. This essay tries to examine and discuss both views with the advantages and disadvantages along with the author's point of view. Since  the museums, art galleries or exhibitions carry essential value for the humanity to show the cultural heritage and history, these important places should be free to enter. This facility leads millions of people to visit these precious places with an increasing interest every year. To illustrate this fact, we can say that schools are in a demand for arranging tours t

Berfin Bozdemir - 11

Image
Eating sweet foods produces acid in the mouth, which can cause tooth decay. (High acid levels are measured by low pH values) Describe the information below and discuss the implications for dental health. The line graph illustrates the acidity caused by the three given sweet foods, Fruit sugar, Cane sugar and Honey with the time period of their consumption. Overall, it can be clearly seen that the presenred three sweety foods can be harmful for dental health due to their acid levels and all of them can reach the same level of pH after half an hour of their consumption. To begin, the sharp increasing trend of three sweetened foods are similar with each other from the moment  they are consumed . The pH level of these foods start from the same value (7 pH) and  experie nce a dramatic drop  in  the first five minutes in our mouth.  While  the acidity of Honey remains steady between the fifth and tenth minutes, those of Cane sugar and Fruit sugar start to rise from th

Candan Şeviktürk - 8

Image
Below is a map of the city of Brandfield. City planners have decided to build a new shopping mall for the area, and two sites, S1 and S2 have been proposed. Summarize the information by selecting and reporting the main features and make comparisons where relevant. The map illustrates two proposed sites for building a shopping mall in the brandfield. Overall, it can be seen that the two sites under consideration are located in the north and south of the town and both the sites seem to be convenient for this aim. Firstly, it is noticed that site 1 includes Housing Estate, and Indistural estate and some   parts of the river and the roads that   are situated in the north part of the map. Building a new shopping mall in this area has some benefits because it will be close to the Housing and Industrial areas, which means easy access for the shoppers and good business for the markets in the mall. As for the the site 2 based in the south site of the map, it can be said that it takes

Candan Şeviktürk - 7

Image
The graph shows Underground Station passenger numbers in London. Summarise the information by selecting and reporting the main features, and make comparisons where relevant. The line graph shows the number of London Underground Station passengers in the hours from 6.00 to 22.00. Overall, as it is seen after a lot of fluctuations there are two peak points and two dip situations with the same values in the whole graph. London Underground Station's passengers start to use the underground station at 6.00 AM, but there are limited passengers with the number 100. From the hours 6.00 to 8.00, which is the rush hour time to work or school, the number of passengers increase sharply to reach its peak point with 400 passengers. During the hours from 8.00 to 10.00, the number of passengers decline dramatically. In the time period from 10.00 to 14.00, the graph shows that the number of passangers rise again. After 14.00, the number of passenger shows dip point with 100 passengers which is

Berfin Bozdemir - 10

Some people feel that entertainers such as film stars, pop musicians or sports stars are paid too much money. Do you agree or disagree? Which other types of job should be highly paid? Give reasons for your answer and include any relevant examples from your own knowledge or experience. It has always been believed that entertainers such as film stars, pop musicians or sports stars gain high amounts of money as the sector of entertainment is a popular area. This essay tries to examine this statement and describe other types of jobs that should be highly paid. Entertainment as a demanding sector in the globe, provides famous people large amounts of money. To illustrate this fact, we can readily say that sports players or actors earn billions of money on each match or each episode of TV series. In addition, similar situation is evident in terms of musicians. For instance, musicians, pop singers or rock groups or even dancers get enormous payments just for one concert. Moreover,

Candan Şeviktürk - 6

Image
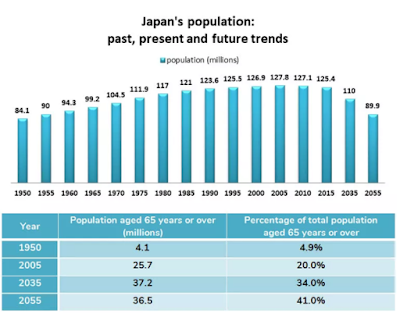
The chart and table below give information about population figures in Japan. Summarise the information by selecting and reporting the main features and make comparisons where relevant. The bar chart represents Japan's population from 1950 to 2055, a 105 years period. The table shows 65 years old or over population in millions and the percentages of the total population of this age group. Overall, it is seen that the number of population in millions follows an increasing trend from 1950 to 2005. According to the given data in the bar chart, while the population was 84.1 million in the begining of the period, it touched its peak point after 55 years in 2005. Yet, after a decreasing inclination from this year, it is clear that it will end the duration with 89.9 million in the year 2055. The table demostrates that both the population and the percentage of the elderly generation experienced an augementaion in the given time period. It is seen that after 105 years the population of

Candan Şeviktürk - 5

Image
The graph below shows the amounts of waste produced by three companies over a period of 15 years. Summarise the information by selecting and reporting the main features and make comparisons where relevant. The line graph provides information about the amounts of waste produced in tonnes by three companies from 2000 to 2015. Overall, it is seen that while companies A and B showed almost a similar pattern in time, company C demonstrated a totally different attitude. At the beginning of the period, it is quite obvious that company A produced the highest amount of waste with 12 tonnes in the year 2000. However, it started a steady decrease after this year to reach its lowest value, which was 9 tonnes of waste in the year 2015. From the year 2000, company B started to experience a sharp climb until the year 2005. Yet, similar to company A, it also followed a declining trend to get its final value, 3 tonnes in the year 2015. Hence, there is a downward trend in both company A and company

Candan Şeviktürk - 4

Image
The chart below shows the results of a survey of people who visited four types of tourist attraction in Britain in 1999 Summarise the information by selecting and reporting the main features and make comparisons where relevant.   The pie chart illlustrates the visits to four different types of touristic places in Britain in 1999. The table graph represents the percantage of tourist attraction in theme parks. Overall, it is seen that theme parks have the highest rates of visits and Blackpool Pleasure Beach in the theme parks is the most preferred place for the tourists. The minimum visiting rate belongs to Wildlife Parks and Zoos This pie chart shows that theme parks have the highest rates with 38% among the given tourist attractions. The propotion of visits to Museums and Galleries is very close to that to Theme Parks with 37%. While the percentage of visits to Historic & Monuments comes in the third place with 16%, surprisingly, wildlife parks and Zoos have the lowest part with

Başak Baytekin - 5

Both the reading and the listening passages discuss about a fossil of a dinosaur that can still have the actual tissues of animals. The reading passage agrees with this idea and gives three explanations. On the other hand, the listening passage finds these explanations skeptical. Firstly, the author explains that in the fossils bone's channels there are soft, flexible material. These kinds of materials were saved by the remains of the actual blood vessels. Contrary to this, the lecturer claims that soft, flexible substances do not need blood vessels to be preserved. Since they make colonization, they can  be protected . Secondly, the writer states that there are red blood cells which have role in transporting oxygen. In addition to this, they have inclination to be red because they contain iron. In contrast to this, the speaker argues that because reddish minerals are evolved they may have different origins. Thirdly, the author explains that the fossil leg bone contains colla

Başak Baytekin - 4

Do you agree or disagree with the following statement? One of the best ways that parents can help their teenage children prepare for adult life is to encourage them to take a part-time job. Use specific reasons and examples to support your answer. In our contemporary world, children have to learn adulthood life. There are a lot of options while a teenage child learns how to become an adult. From my perspective, encouraging the teenagers to take a part time job is not one of the best ways. Therefore, I come out against the given statement because of two reasons which I will explore in the following essay. To begin with, today's teenage children have many responsibilities in their education. They have to prepare for their exams and do homework. While they are struggling with these kinds of stuff, they are forced to compete with their companionship. These situations make them stressful and distract their focus. In addition to this pressure, if parents encourage them to take part-

Merve CURA - 6

Image
The map below shows the development of the village of Ryemouth between 1995 and present. Summarize the information by selecting and reporting the main features and make comparisons where relevant. The changes of a village named Ryemoth, from 1985 until today, are demonstrated by two maps. It can be seen that farmland and forest park were removed, and were replaced by some sports facilities. The fishing industry of the village demised, while the residential areas increased. A careful look to the north of the maps reveals that in 1995 Raymoth had a forest park and farmland to the north-east of the village. Forrest park was cut down and merged together with the tract of former farmland. This area was converted into sports facilities, such as golf and tennis fields. It can also be seen that residential area in the north-west of the village did not show any dramatical changes, except the newly constructed buildings and the extension of the road leading to the west of the maps. During

Candan Şeviktürk - 3

Image
The chart below shows the amount of leisure time enjoyed by men and women of different employment status. Write a report for a university lecturer describing the information shown below. Leisure time in a typical week in hour- by sex and employment status, 1998-99.         This bar chart represents leisure time in a typical week by women and men of different employment in five categories from 1998 to 1999. Overall, unemployed and retired male and females spend the highist amount of time on leasure activites . The bar chart shows that full time employed males spend a little bit more time than full time employed woman. It is clearly seen that part time employed females spend time a little more than full time employed females do. However, there is no data about part time employed males. As for unemployed and retired people, it is obviously noticed that males and females experienced simillar situations which are over 80 hours per week for males and slightly less tha

Arzu Kırıcı - 4

Some educationalists think that international exchange visits benefits teenagers at the school. To what extent do advantages outweigh the disadvantages? Along with the developing society, some researchers demand younger generations to expand their educational horizons and skills through exchange visits. I strongly believe that educational exchanges have certain advantages for students and for their schools. This essay will examine the veracity of the phenomenon of international exchange visits and my point of view. To begin with, social development has brought several imperatives to our lives. One of them is studying in a foreign country. In other words, adolescents who live this experience, will find pleasure to discover a new culture, language and a different lifestyle, which will broaden their minds forever. For example, many schools start to become international, especially in the EU countries. Some have a specific opportunity such as the Erasmus student exchange program, wh

Alp YURDAKUL - 6

Some people believe that visitors to other countries should follow local customs and behaviour. Others disagree and think that the host country should welcome cultural differences. Discuss both these views and give your own opinion. Tourism has outstandingly sprouted up for human beings throughout the history of settlement. Nevertheless, some individuals are of the opinion that the tourists on abroad should get accustomed to local traditions, whereas others reckon that visited countries need to cater for helpful organizations. In this essay, one reason for each thought and the author's personal view are represented. On one hand, the visitors in another state do not have to expect some elements related to their culture since they go to that country to learn new traditions. It is a well-known fact that a plenty of people visit new places annually and many of the lands are decorated with miscellaneous cultures. However, as foreigners do not pay attention to these traditions, they

Simge KAYA - 4

Image
The diagram illustrates the process that is used to manufacture bricks for the building industry. Summarize the information by selecting and reporting the main features and make comparisons where relevant. The diagram depicts how to make bricks which are used for the building industry. Overall, there are eight stages in the process, from digging up the clay to the delivery of bricks with a vehicle. To begin, the raw material which is clay is dug up from the ground by a digger. Following this, a metal grid is used to split this clay to produce smaller pieces. A roller acts in this process and water is added into the obtained sand. After this process, the mixture is ready to be shaped in two different ways, by either putting it in a mould or cutting it with a wire. Those shaped bricks are placed in an oven to dry for 24 - 48 hours. Next, there are two heating stages by using kilns. The bricks are exposed to a moderate temperature (200-980°C) in the first stage, while in the se

Merve CURA - 5

Some people think that the main factors influencing a child’s development these days are things such as television, friends, and music. Others believe that the family still remains more important. Discuss both opinions and give your opinion. Give reasons for your answer and include any relevant examples from your own experience or knowledge. It is argued that television, friends, and music have the primary effect on a child's development; whereas, there are other people who are crowded enough to be underestimated believe that family is still has a preeminent place on a child's development. Personally, I partly agree with both ideas, depending on the child's age. The effect of social interactions, like friends and popular culture's perfect picture created by television and music, on child development is not a secret. Children, specifically teenagers can easily get affected by these kinds of external stimulations. For teenagers, the most important thing is the app