Posts

Showing posts from March, 2021

Başak Baytekin - 3

People benefit more from traveling in their own country than from travelling in other countries. Do you agree or disagree? Travelling is really beneficial for our mental and psychological condition. When we travel, we can discover new places and we can easily avoid stress. From my perspective, people benefit more from travelling in their own country; so I come out in favour of the statement. There are two reasons why I think like this and I will explain it in the essay below. To begin with, travelling influence our lives positively. While travelling, we can extend our views of life. We can get a lot of knowledge about places, cultures, historical or natural places, and traditional foods and so on. Therefore, I think people should first discover their own country. In contemporary world, we have too many options to discover our homelands. Unfortunately, we do not use these opportunities. However, we prefer to discover other countries rather than our own countries. For example, whenever

Başak Baytekin - 2

Both the reading and the listening passages mention about salvage logging. The reading passage supports the idea that salvage logging is beneficial to damaged forest and that region’s economy. On the other hand, the listening passage claims that it is not a really effective solution. Firstly, the author states that after a disaster, the salvage logging helps remove dead trees and make new areas to grow fresh trees. The lecturer does not agree with this, she says cleaning dead trees can cause freshly growing trees get lack of nutrition. Secondly, the author claims that harmful insect numbers can increase. For this reason, healthy trees can get damaged. In contrast to this, from the lecturer’s point of view, it is not a bad matter. In long term, it can be beneficial for other species. Thirdly, the author thinks that salvage logging can create additional jobs for local dwellers. Therefore, it positively affects that region’s economy. The lecturer opposes this idea, because it only ha

Emine Şeyda Satılmış - 2

Image
The bar chart shows the number of times per week (in 1000s), over five weeks, that three computer packages were downloaded from the internet. Summarize the information by selecting and reporting the main features and make comparisons where relevant. The bar chart gives information about ActiveX, Java and Net which are four computer programs downloaded from the internet in five weeks period. The data in the chart point out their download rate per week. Overall, while ActiveX has the highest download rate, Net was the least preferred program. Firstly, ActiveX and Java followed the same pattern according to the chart. Although the download rate of ActiveX computer package scaled up in the first three weeks, it experienced a slight fall in the fourth week but kept its brising trend until the fifth week. Despite this situation, ActiveX was the most popular computer package to download. As for Java, it is noticed that it gradually increased from week 1 to week 5. In week 1, the do

Berfin Bozdemir - 7

Some organisations believe that their employees should dress smartly. Others value quality of work above appearance. Discuss both these views and give your own opinion. In today's developing world, various types of professions require their employees to wear in a way to attract customers' attentions to their marketplaces. Due to this fact, the requirements are changing day by day. There is a controversial arguement whether employees should necessarily dress smartly or there is no need for such trend and effect in the business. This essay tries to examine and discuss both views along with the author's personal point of view. To begin with, I believe that dressing is an effective way to express yourself and a good manner of representing your profession. Moreover, it shows how much you appreciate your job and your boss, as well. Hence, it can be vital to dress as it is a requirement of an office and in some businesses such as law, bureaucracy, consulting, or even in medi

Emine Şeyda Satılmış - 1

Image
The line graph below shows changes in the amount and type of fast food consumed by Australian teenagers from 1975 to 2000. Summarize the information by selecting and reporting the main features and make comparisons where relevant. The line graph illustrates the fast food consumption habits of Australian Teenagers between the years 1975 and 2000. In this chart, three various fast food products are defined according to the number of times they were eaten per year. These products are fish and chips, pizza and hamburgers. Overall, during the period of 25 years, itis seen that the rate of eating hamburgers and pizza increased while that of fish and chips went down. Firstly, this chart obviously shows that fish and chips was far more popular fast food than pizza and hamburgers in 1975, although it fluctuated between 1975 and 1985. This popularity started to decrease after 1985. Fish and chips was consumed approximately 100 times a year by Australian teenager in 1985 while this rate d

Berfin Bozdemir - 6

Image
The graph below shows the number of university graduates in Canada from 1992 to 2007. Summarise the information by selecting and reporting the main features and make comparisons where relevant. The line graph illustrates the number of females and males who graduated from university in Canada over the years 1992 and 2007. Overall, it can be clearly seen that graduated women outnumber graduated men in the whole time period. To begin, the number of women who graduated started the period from just under 100,000 in 1992. After a gradual increase, it followed a slightly decreasing trend until the year 1999. After almost the second half of the period which is after the year 2000, it experienced a significant rise and culminated at its peak point with approximately 148,000 number of graduates. Moving to men, we notice that the rates in this category were by far less than those in the women category. The number of bachelors in terms of men started from 70,000 and followed

Candan Şeviktürk - 2

Image
The bar chart shows the number of times per week (in 1000s), over five weeks, that three computer packages were downloaded from the internet. Summarize the information by selecting and reporting the main features and make comparisons where relevant. The bar chart represents  three computer packages from the internet, ActiveX, Java and Net which were downloaded in five week period. Overall, it is seen that while ActiveX is the most downloaded package, Net is less downloaded one. In the first week, the number of downloaded Net package started with less than 40, but it followed a decreasing trend until week 3 when it experienced its lowest value. After week 3, it started to increase until the end of the period. At this point it touched its peak point with almost 60 downloads. As for Java, it is noticable that it started over 40 downloads in the first week and continuously increased slowly and linearly to reach its highest point at 80 downloads in week 5. Obviously, from week1 to wee

Gökhan Eren Karakulak - 2

Image
The bar chart shows the number of times per week (in 1000s), over five weeks, that three computer packages were downloaded from the internet. Summarize the information by selecting and reporting the main features and make comparisons where relevant. The bar graph gives us the weekly download numbers of Java, Net and ActiveX computer programs, over five weeks. Overall, when we look at the entire 5 weeks, we notice that all program downloads increased in the fifth week compared to the first week. The rate of ActiveX computer program is considerably higher than those of Net and Java. This number is approximately 70 in the first week, while more than 120 in the fifth week. Even if it rises, there is a small decrease in the fourth week. As for the Java program, in the first week, the value of Java program is approximately 38. This number followed a linear increasing trend to touch its peak point at slightly more 80 number in the fifth week. If we examine the Net program in more d

Özge Top - 4

Image
The table shows the Proportions of Pupils Attending Four Secondary School Types Between 2000 and 2009. Summarize the information by selecting and reporting the main features and make comparisons where relevant. The table chart illustrates the rate of school children in four variable school categories from the year 2000 to the year 2009. Overall, it can be seen that the rate in Community Schools reached its peak, while that in the Voluntary-controlled Schools decreased dramatically in the given 9 years period. In details, the percentage of students in the Specialist Schools declined slightly by two percent. In addition to this, the rate in the Grammar Schools slumped by 12 percent in this nine year period. While the Voluntary-controlled Schools were preferred most with the proportion of 52 percent in 2000, it had a substantial rise by 20 percent in 2009. During nine years, while the Community Schools had 12 percent in 2000, it experienced a sharp jump to 58 percent in 2009. To s

Candan Şeviktürk - 1

Image
The line graph below shows changes in the amount and type of fast food consumed by Australian teenagers from 1975 to 2000. Summarize the information by selecting and reporting the main features and make comparisons where relevant. The line graph represents the consumption of fast food by teenagers in Australia in a time period from 1975 to 2000. The fast food types are hamburgers, pizza and fish and chips. Overall, it is seen that while pizza and hamburgers got popular in time , the consumption of fish and chips decreased. During the years 1975 and 1985, the consumption of hamburgers and pizza presented an increasing trend. This trend continued but it was much slower for hamburgers than pizza until the year 1995 when both pizza and hamburgers consumption remained stable until the year 2000. In 1975, fish and chips was the most consumed fast food by Australian teenagers. But this popularity started to decline until the year 1980. In this year, it started to rise until 1985 but

Simge Kaya - 3

Image
The pie charts show the main reasons for migration to and from the UK in 2007. Summarize the information by selecting and reporting the main features and make comparisons where relevant. The pie charts illustrate the primary reasons for immigration and emigration of the people in the UK in the year 2007. Overall, it is quite clear from the chars that the employment issues are the main excuse that lead people to choose to migrate. At first, the biggest area is about the definite job that accounts for 30 percent of immigration. This reason shows similar pattern in the emigration chart with almost the same percentage. While formal study stands in the second rank in the chart of immigration from other countries to the UK with 26% value, this motive occupies the least area in the emigration chart from the UK. The reason for joining a family as a member has quite similar rates for both immigration and emigration, with 15% and 12%, respectively. Apparently, it is seen that people de

Aras Kuzucu - 7

Image
The diagram below shows the average hours of unpaid work per week done by people in different categories. (Unpaid work refers to such activities as childcare in the home, housework   and   gardening.) Summarise the information by selecting and reporting the main features, and make comparisons where relevant. The bar graph illustrates avarage unpaid works which are housework, childcare and gardening hours per week with three different categories. Overall, it is clearly seen that all married women spend more time on these works than all married men do. To begin with, the bar chart reveals the fact that in general married women spend 50 percent more time than married man do in the category of couples without children. When the couples have 1-2 children, a sharp increase (%70) can be noticed in the work hours of women, while interestingly no change in the work hours of men is observed. As for the 3+ children families, the case is even more interesting. While, the trend of increasing w

Aras Kuzucu - 6

Some people think that there should be strict laws to control the amount of noise a person makes because of the disturbance it causes to people. Discuss the advantages and disadvantages. In today's world, noise pollution is a serious issue in the big cities. Some people claim that laws should be regulated to reduce noise amount in the environment. However, these laws can lead to the restriction of freedom and other activities of people. Some people in the society hold the idea that the amount of noise in the cities need to be regulated by legislations. They support their ideas though some reasons. First and foremost, the psychology of people is affected easily by the amount of noise. If quiet places become more popular, people will be healthier and more efficient in their daily lives. Furthermore, this will affect the quality of the cities; for example, people can be more polite to each other and more aware of their environment. Another good side of the less noise is the build

Alp Yurdakul - 5

The following table gives statistics showing the aspects of quality of life in five countries. Summarize the information by selecting and reporting the main features and make comparisons where relevant. Country GNP per head (1982: US dollars) Daily calorie supply per head Life expectancy at birth (years) Infant mortality  (per 1000 live births Banglade Bolivia Egypt Indonesia USA 140 570 690 580 13160 1877 2086 2950 2296 3653 40 50 56 49 74 132 124 97 87 12 The table illustrates some stats in four categories related with the aspect of life quality in such countries as Bangladesh, Bolivia, Egypt, Indonesia and the USA in 1982. Overall, Bangladesh was the country where the most infant mortality per thousand of live birth happened, whereas

Özge Top - 3

Artists need a certain amount of freedom to develop their creativity. Some people think that artists should have total freedom to express their thoughts and ideas. To what extent do you agree or disagree? It is considered by most of the people that an artist needs freedom on their working issues in order to be able to create a piece of art. Some people think that freedom can create chaos among people with different life styles. In this essay, I am going to shed some light on this question from both points of views and then give my own opinion on this matter. On one side of this argument, people argue that artist who puts forward their own work of art should be free. The main reason for believing this is that an artist has the duty to awaken the awareness of the the society they live. If an artist does not have enough freedom of expression, the community and culture of the society will be seriously damaged. For example, Amadeus Mozart came up with Austria's battle with Ottoman Empi

Arzu Kırıcı - 3

Image
The line graph shows visits to and from the UK from 1979 to 1999, and the bar graph shows the most popular countries visited by UK residents in 1999. Summarize the information by selecting and reporting the main features and make comparisons where relevant. The given line graph shows the number of visitors arriving in the United Kingdom and indigenous people travelling abroad over a period between 1979 and 1999. Additionally, the bar chart depicts the countries which were frequently visited by the British in the year 1999. Overall, there was an increase in both arrival of visitors as well as departure of the UK residents over this period. France was the most favorite destination while Turkey was the least visited country by the Great Britain people in 1999. To begin, In 1979, 10 million overseas residents made a trip to the UK while around 12 million the UK people went abroad. From 1979 to 1985 there was a slight increase in the number of tourists by around 2 million which was almo

Arzu Kırıcı - 2

Image
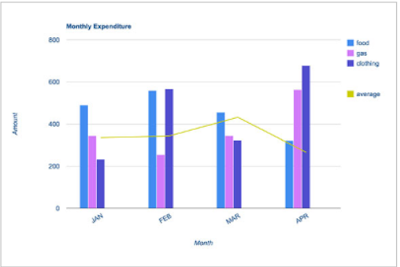
The bar chart shows the monthly spending in dollars of a family in the USA on three items in 2010. Summarize the information by selecting and reporting the main features and make comparisons where relevant. The bar chart compares the monthly expenditure on food, gas and clothing of a family living in the USA in 2010. Overall, it is quite noticeable from the given chart that the levels of expenditure fluctuated over the period. The expenditure was in dollars and legends depict the different items. To begin, in January, most of the family's income was spent on food, at approximately $500 per month, whilst the least money was spent on gas and clothing, on average $300 and $230, respectively. In February, the amount of money spent on food and clothing increased slightly compared to that in January. Because of the cold weather in February, the amount of spending on gas decreased as the use of vehicle reduced due to weather conditions. In March, the expenditure on food and clothing dro

Aras Kuzucu - 5

People now have the freedom to work and live anywhere in the world due to the development of communication technology and transportation. Do the advantages of this development outweigh the disadvantage Many countries of the world accept and give migration from different countries for working, living and educational purposes. Besides, today's world technology is providing communication and transportation between long distances. In my opinion, the advantages of this phenomenon weigh more than the drawbacks. To begin with, the disadvantages of going overseas can be underlined as its bad effects. For instance, family bounds would be weaken even if the communication is available. People would feel uncomfortable with the culture of the foreign countries and they may experience difficulties in getting adapted to a new culture. Another reason may be the financial situation of the person. Most of the people do not have enough budget to live in another country. As a consequence of this,

Aras Kuzucu - 4

Some people think that hosting an international sports event is good for the country, while some people think it is bad. Discuss both views and state your opinion. Give reasons for your answer and include any relevant examples from your own knowledge or experience. All around the world, arrenging global sports activities in a local country has many benefits for nations. Many people believe that hosting a sports event is bad for economy and government. Other people claim that arranging a sport activity brings wealth for a country. I agree with the second opinion. I believe that setting up a sports event is a good way to communicate with other nations and will bring good economical and social results. To begin with, all countries have unique culture and tourism but most of the countries do not know even their neighborhood countries. Olympics games are one of the important activities for nations to gather countries to follow one specific purporse which is sports activities such as

Aras Kuzucu - 3

Most countries offer two education systems from which parents can select the form of schooling which most suits their own child. Compare and contrast state-run and privately-owned schools in your country or in a foreign country. All around the world, the education systems are consisted of a variety of options such as public and private schools avaliable for parents to choose. In my country, the vast majority of the parents choose the state-run schools because of their financial status. Other people prefer private-owned schools to get better education for their children. To begin with, economy is an important factor when choosing the correct type of school. Many parents cannot afford to pay the school fee for private schools and as a result have to prefer the public schools. State-run institutions have many benefits for pupils. For example, they can meet a diversity of students who share the same economical situation. In this way, the bonds of the relationship get stronger than th

İrem Kılıç - 7

Both the listening and the reading are about advantages and disadvantages of working as a team rather than working individually. While the reading suggests that working as a team is better, the listening does not agree with that for several reasons. Firstly, the writer thinks that more people mean more knowledge. Different ideas, different kinds of skills and expertises can be really useful for projects. However, an individual cannot know everything or expertised or skilled enough for every subject. Thus, a team consisting of workers can reach to higher points than any individual. However, the lecturer argues that this idea of the writer is wrong by giving example of a company which tried the "working as a team" system for six months and was not satisfied wtih the project. Secondly, the writer thinks that a group of people can take risk easily because the responsibility is spreaded to the team, not to any single individual. With this way, a team can be really successfull

İrem Kılıç - 6

Image
The graph shows the proportion of the population aged 65 and over between   1940 and 2040 in three different countries. Summarise the information by selecting and reporting the main features and make   comparisons where relevant. The line graph illustrates the distribution of the number of people aged 65 and over in the society of three different countries from 1940 to 2040. Overall, it can be seen that while the USA and Sweden are predicted to share similar patterns over the time period, Japan will display different progression. According to the graph, the USA and Sweden are expected to show very much similar progress in terms of the number of people who aged 65 or over as the time passes. In the USA, the proportion of the population aged 65 and over stood at just under one in ten in 1940, which pointed out the highest percentage of the elderly population compared to the other two countries at that time. Except for the almost steady position from 1980 to 2020, the number of peop

İrem Kılıç - 5

Some people think that the best way to reduce crime is to give longer prison sentences. Others, however, believe there are better alternative ways of reducing crime. Discuss both views and give your opinion. Crime has been a problem since human history. To find a solution for this, there have always been many different offers. While some people believe that long duration in prison is the best way to decrease crime, others claim there are more efficient ways of lessening the crime rates. This essay will discuss both points of view. It is true that giving longer jail sentences might reduce the crime rate in the society because of several reasons. To begin with, criminals in the prison have limited access to the outside world. This could cause them to feel lonely, anxious, or depressed and, no doubt, having a bad psychology in jail makes life much harder for them. They may not eat or sleep very well. A prisoner who experienced this may decide to commit an illegal act never ever. Ano

İrem Kılıç - 4

The illustrations show how chocolate is produced. Summarize the information by selecting and reporting the main features and make comparisons where relevant. The diagram explains how cocoa is transformed to cholocolate. Overall, there are a total of ten stages including a variety of different processeses to complete, starting from growing of the pods in the cacao tree and lasting in the generation of the chocolate. To begin with, the cocoa takes its shape inside the pods which are grown in the South American and African continents and country of Indonesia. When the pods get their red colour and become ripe, they are harvested and their white cocoa beans are taken. To implement this process, the pods' shells are broken. After cocoa beans are removed, they are fermented and sprawled on a large tray to dry under the sun. Following this stage, the broad sacks are filled with the beans and delivered by train or truck to the factory. Once they arrived, beans are roasted at a point

İrem Kılıç - 3

Image
The line graph below shows changes in the amount and type of fast food consumed by Australian teenagers from 1975 to 2000. Summarize the information by selecting and reporting the main features and make comparisons where relevant. The line graph above demonstrates how fast food consumption among Australian teenagers differs in amount and type from 1975 to 2000. In general, while hamburgers and pizza display similar patterns, fish and chips act differently from others in preference of eating fast food. As it can be seen from the graph, being eaten 100 times a year, fish and chips used to be the most favorite consumed fast food by the Australian Teenagers in 1975. This was nearly twenty times more than the consumption of hamburgers and pizza at that time. Nevertheless, except for its brief climb from 1980 to 1985, fish and chips consumption gradually continued its 25 years of decline until it finished at just under 40. In sharp constrat to this, the teenagers steadily increased thei